Analytical and Visualization Tools
3-dimension Visual Data Slices
Datasets are organized into simple, three-dimensional slices “what-where-when”: parameters, objects and periods. There are only three dimensions not to overload the user with unnecessary details and to show a clear picture: what happened to the business, where and when. This gives focus and ease of use.
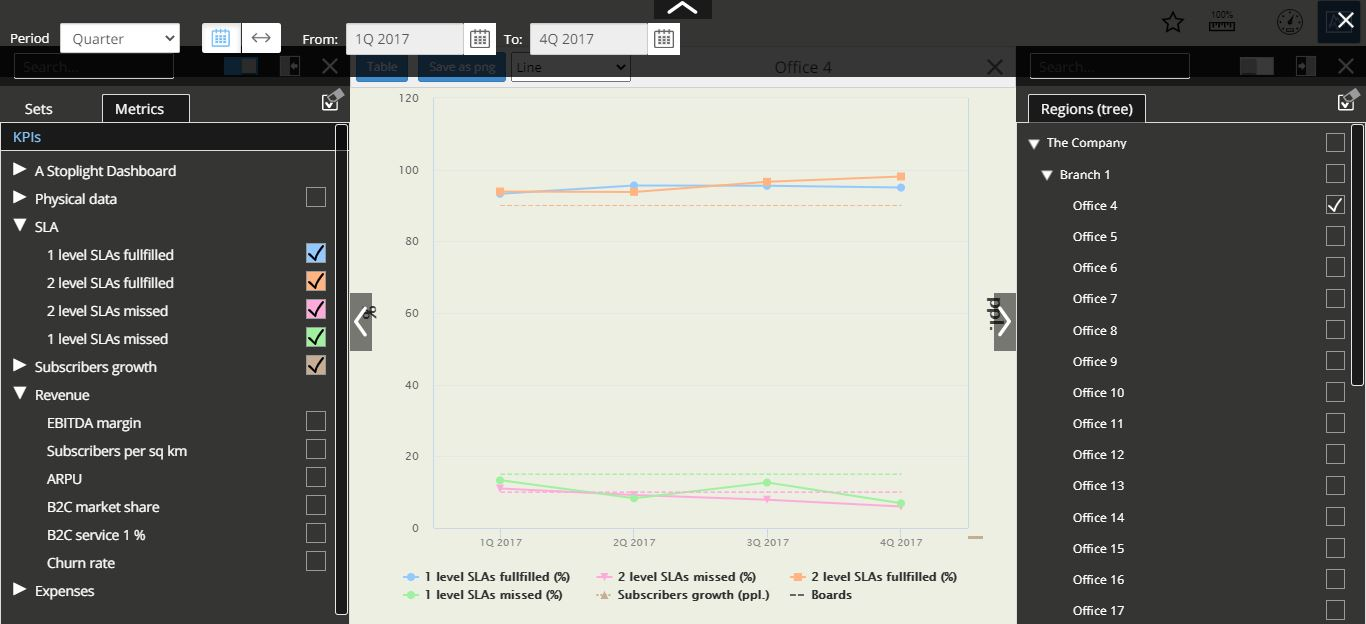
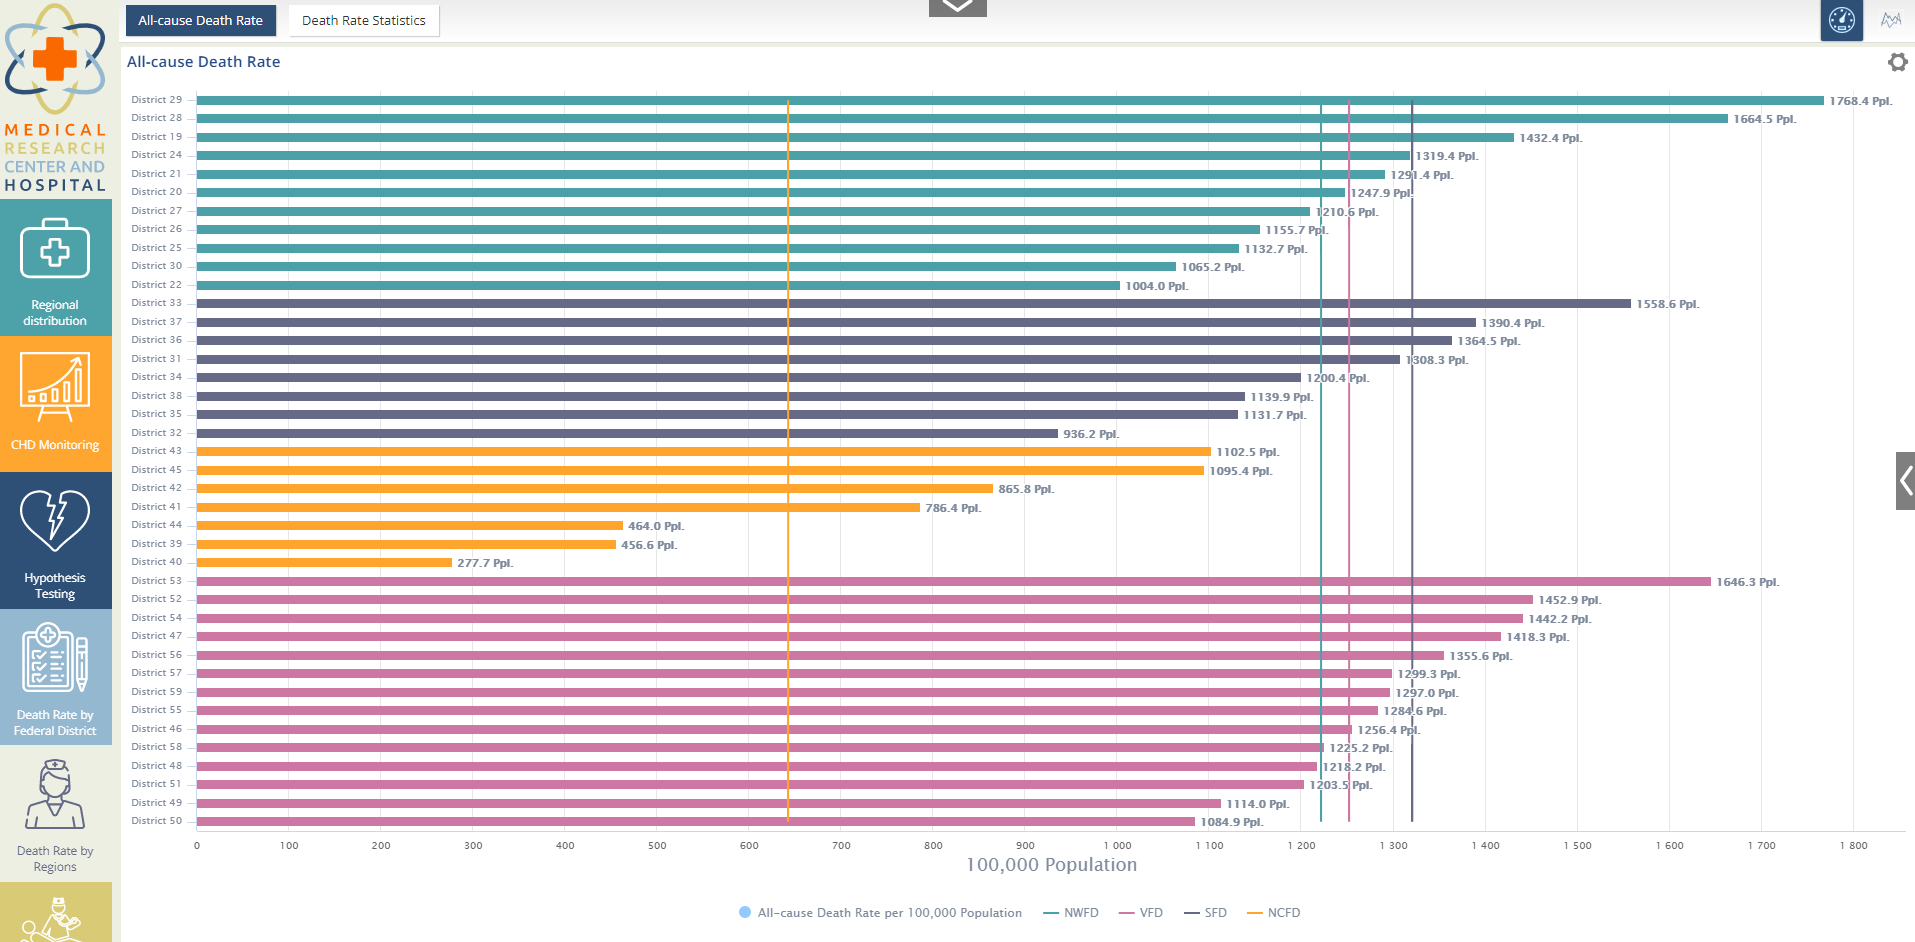
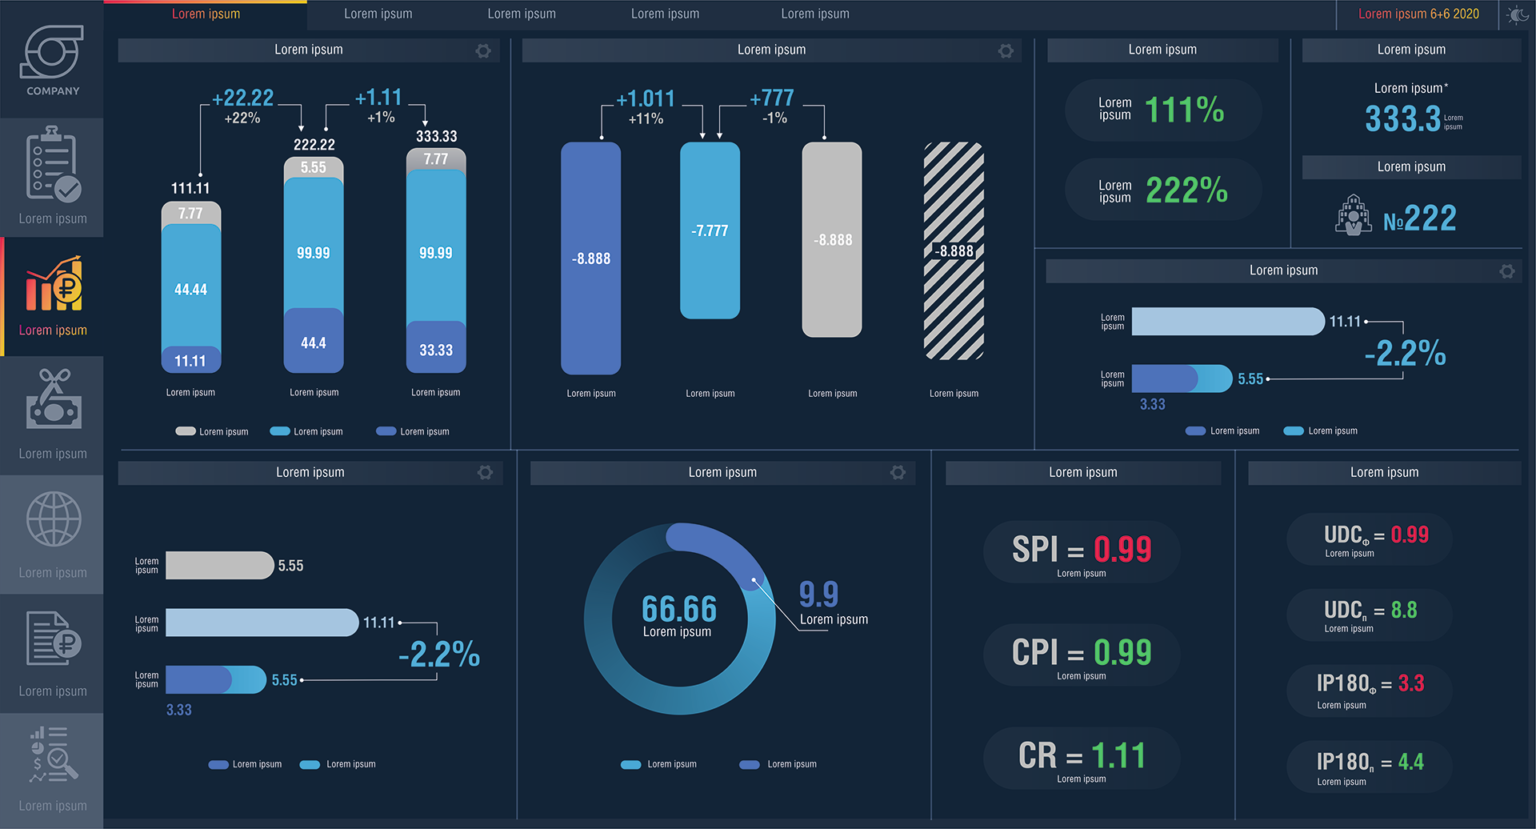
Dashboards
Instead of paper copies and thousand-row spreadsheets, you work with interactive dashboards. They help to quickly track changes for key metrics. Dashboards are pre-configured: you see the most important data first, they are displayed in the most convenient format: as ratings, infographics, diagrams, speedometers. The information is so clear that you can assess the situation at a glance. Data is pulled directly from sources, there is no risk of data corruption or error. All updates are automatic.
Visualization is interactive – you easily switch slices, drill-down, navigate to relevant systems. Dashboards reduce time spent on preparing reports, provide correct and relevant numbers and allow you to interact with data.
Managers’ Personal Desks
Analyze and track individual metrics that correspond to a manager’s area of responsibility.
Example: consolidated performance analytics suitable for both flat and multi-tiered management structures.

Trends
Managers can track Trends specific to their personal needs choosing any parameter, period and object. Compare Offices investigate the relationship of metrics, and analyze dynamics.
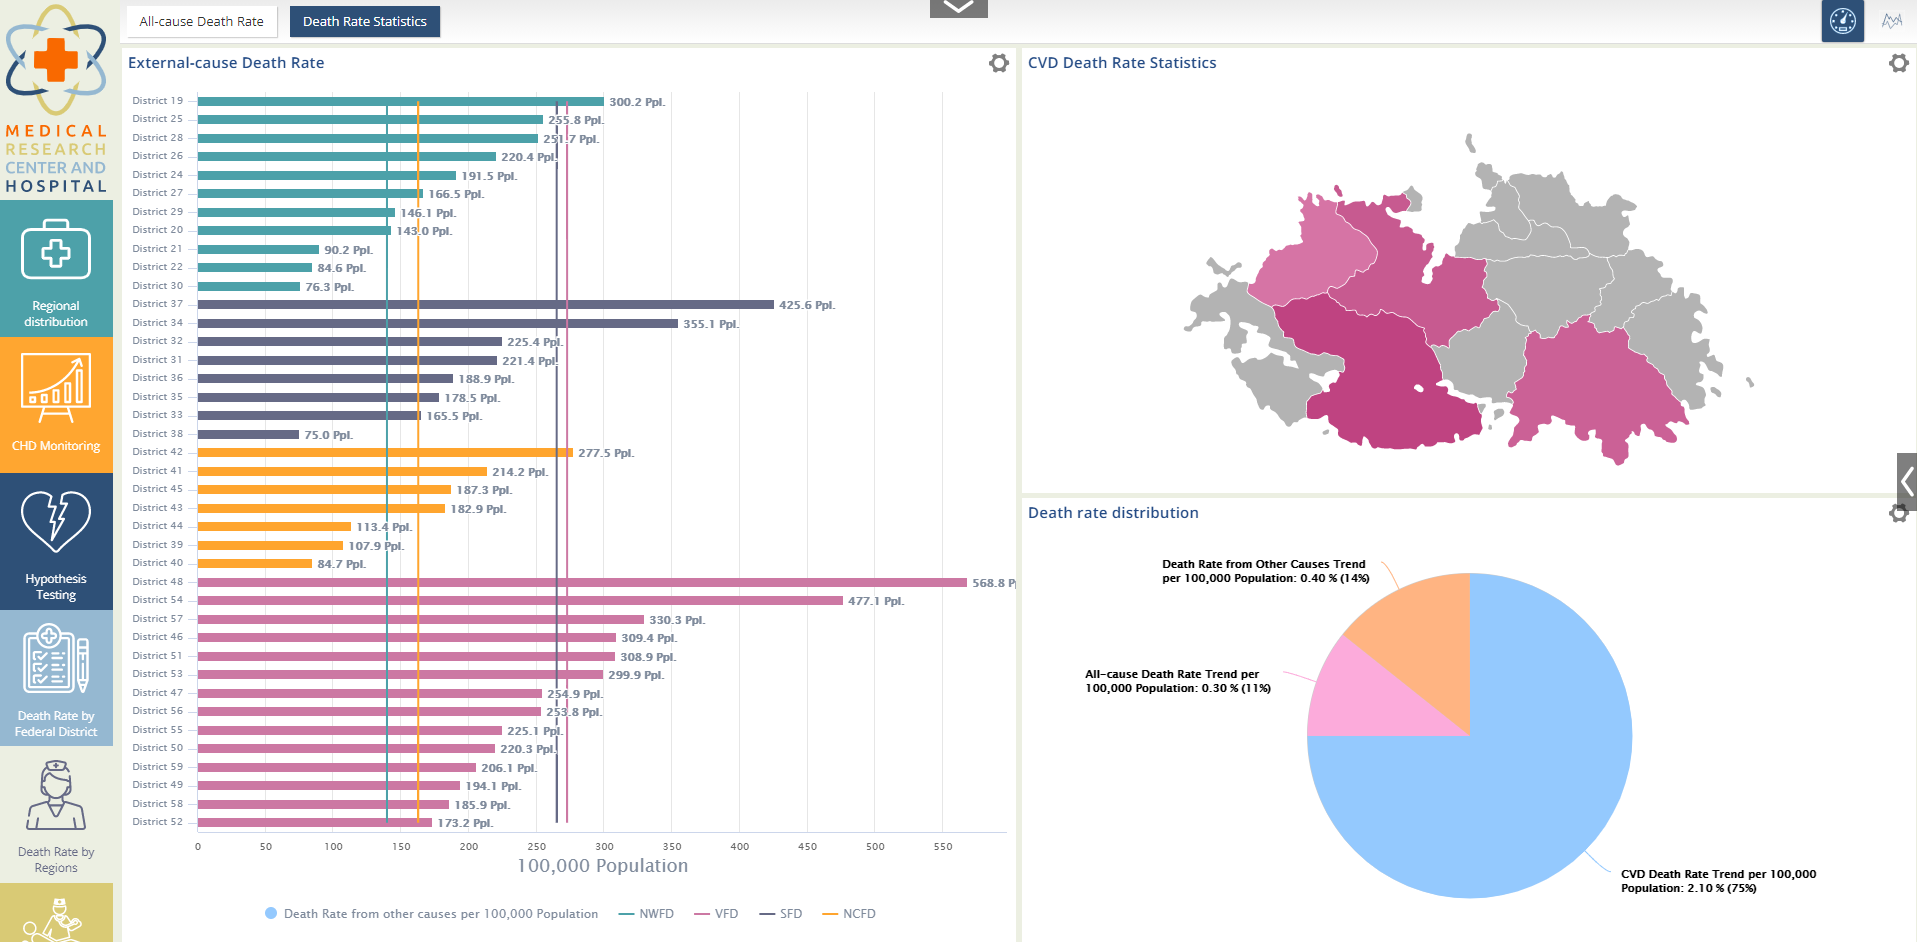
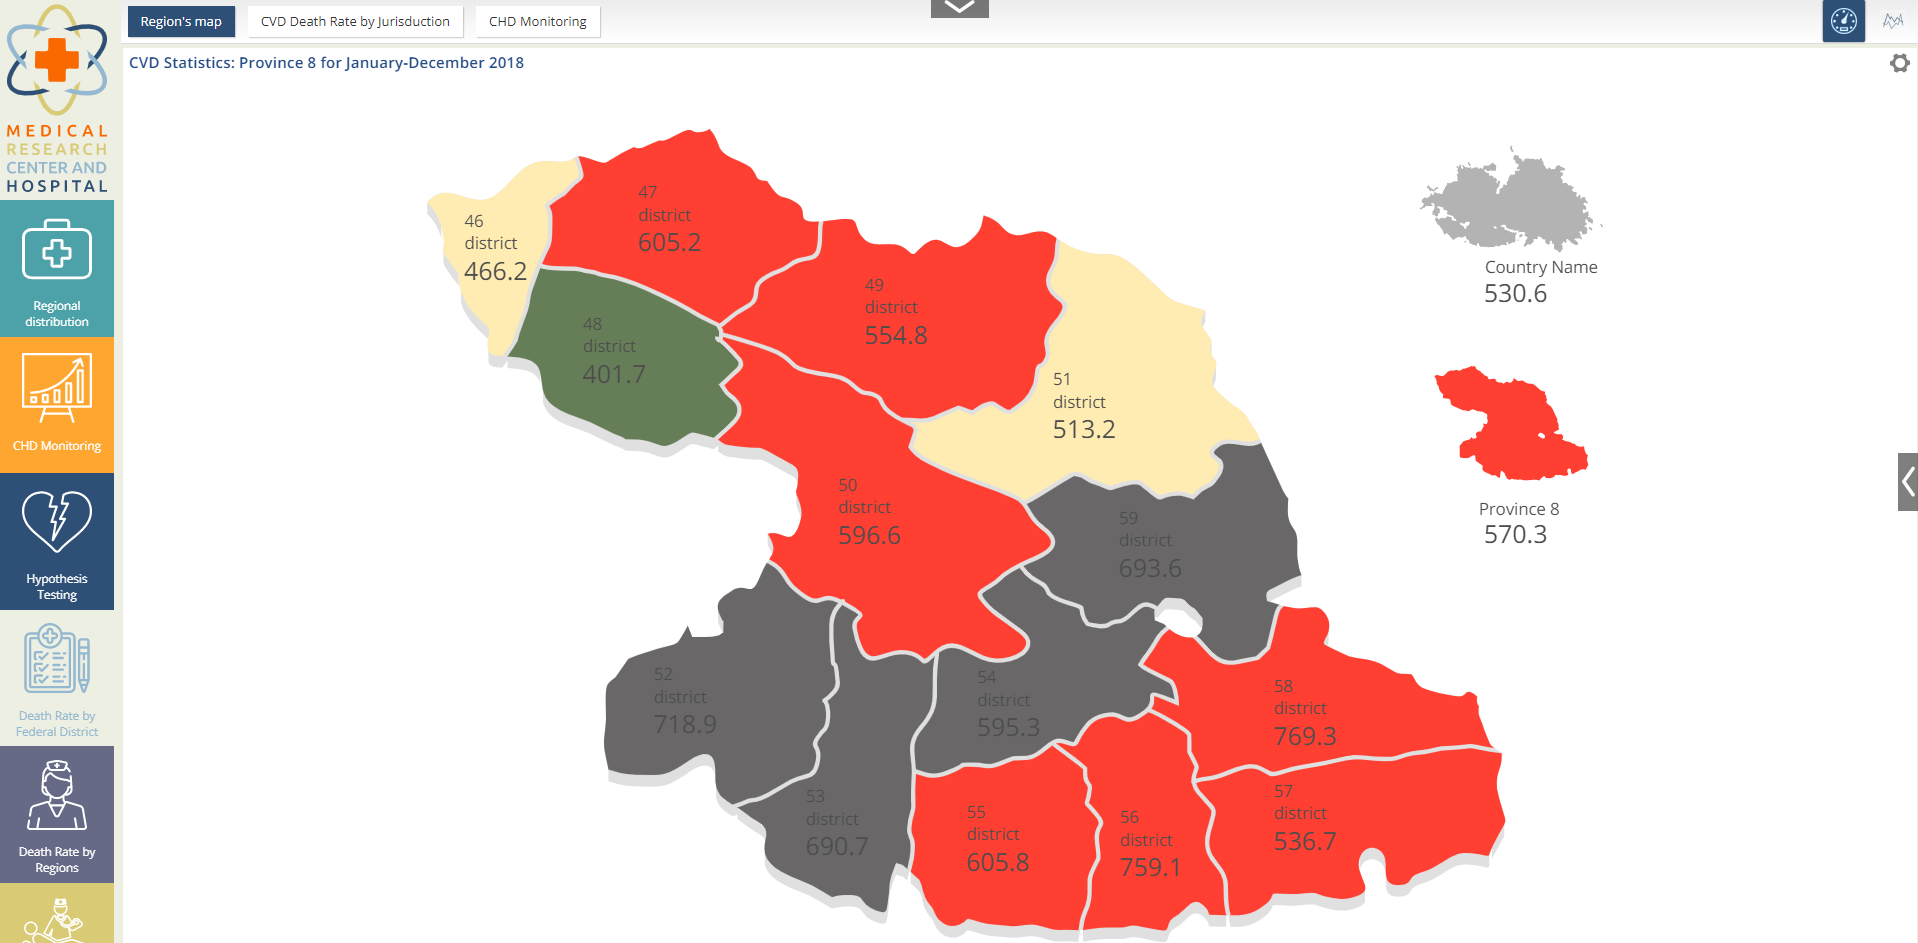
Geomaps
For offices that are geographically dispersed, you can set up analytical maps. Add color-coding. Choose type of object display: as markers, clusters, circuit nodes, 3D models. Customize heatmaps. Supplement the map with infographics or organizational structure.
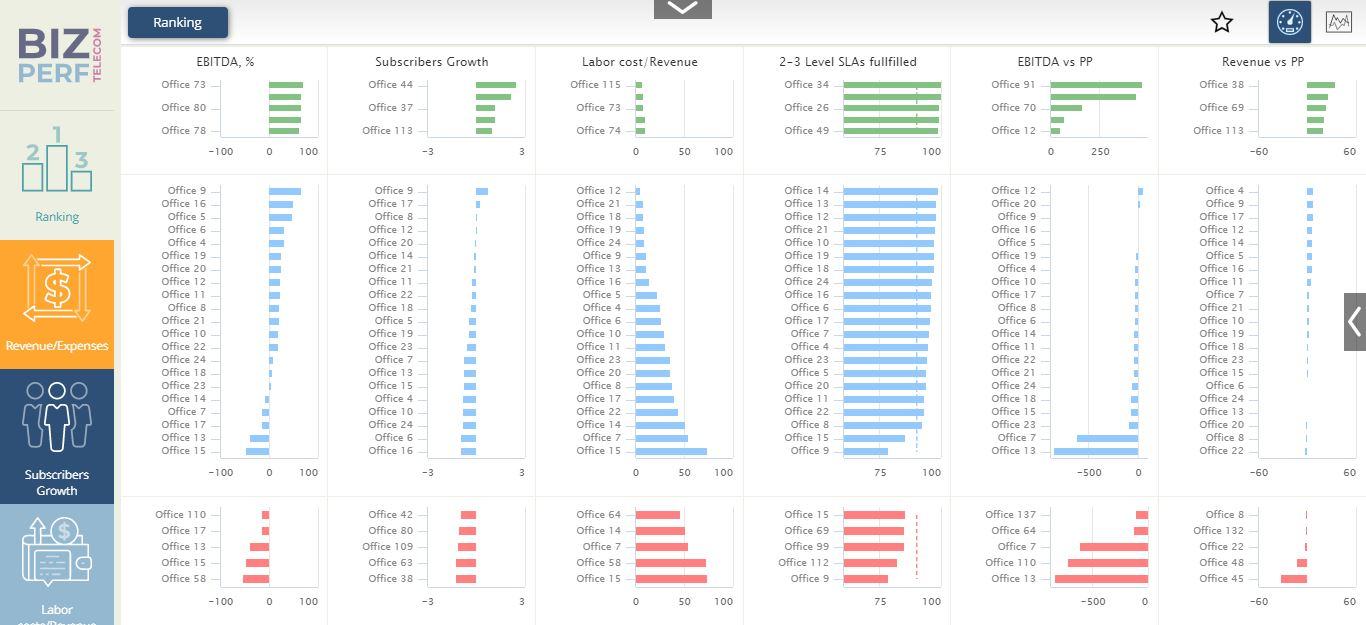
Top Performers Benchmarking
A top manager uses benchmarks to track compliance and help to elevate the performance of all contributors. A head of division can learn from the experience of other managerial contributors.
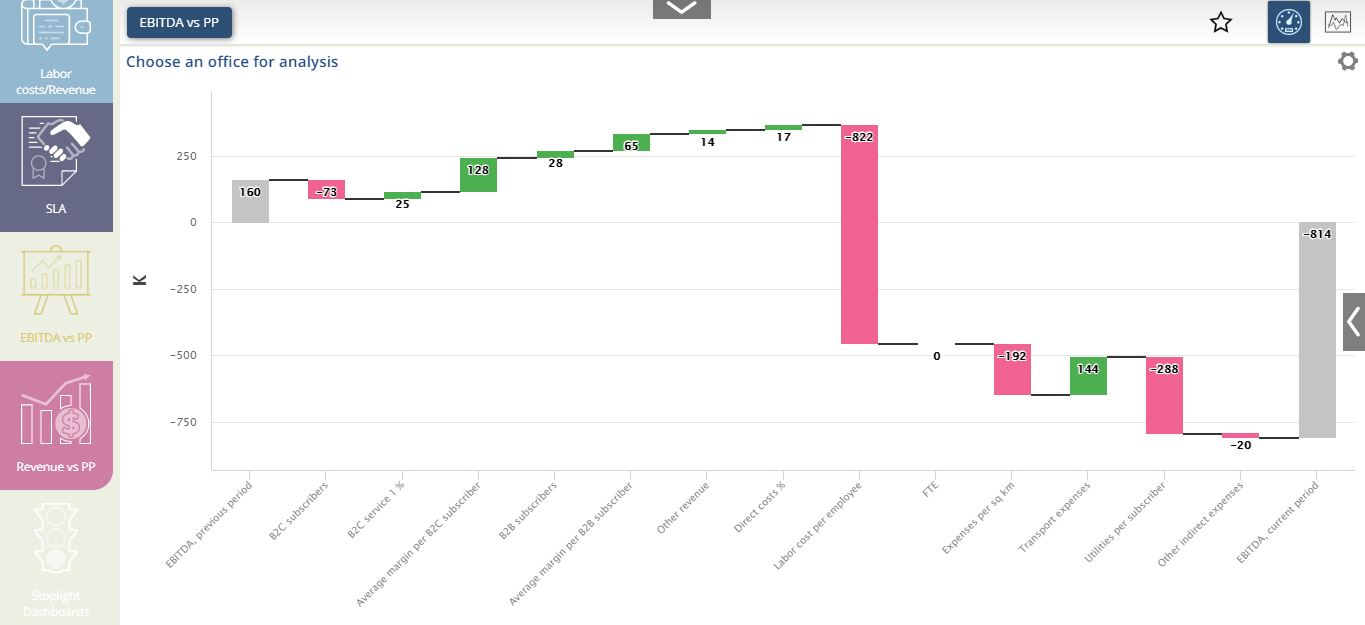
Drill-down to the Root Cause
MPP BI qualitatively changes the way of working with reports: any value can be decomposed right in the interface. You don’t need additional unloads or other reports. You choose the depth and direction of drill-down – by periods, objects or parameters. When primary data is needed, you can go to a relevant information system without losing context.
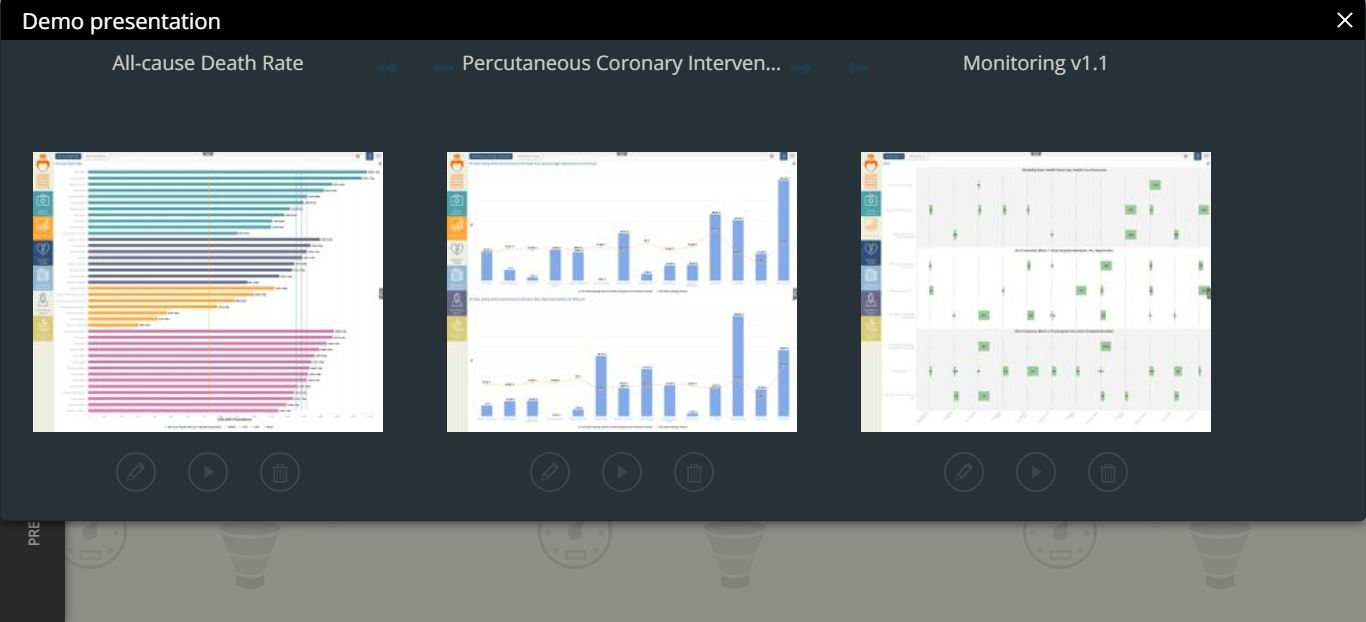
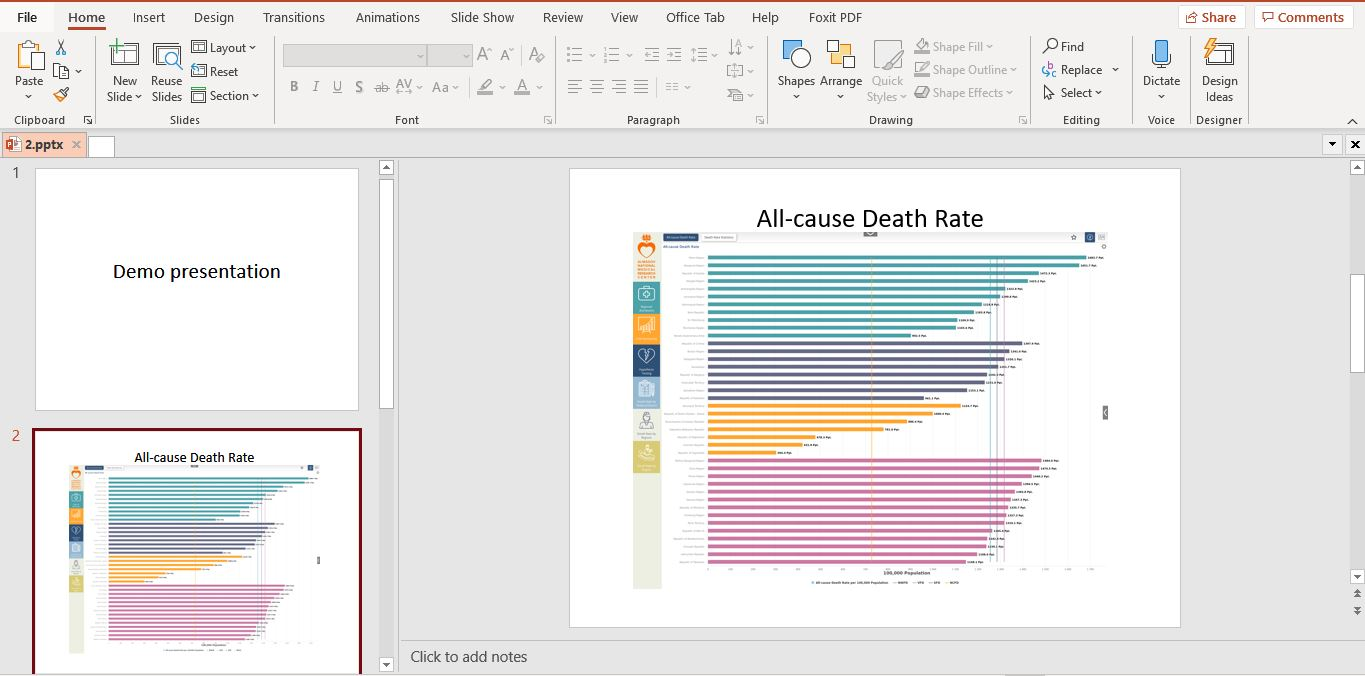
Interactive Presentations
These are live stories that you can show during a meeting or share with colleagues. The screen with the current analysis context becomes the presentation slide. It is possible to play the presentation in the interface, then all the interactive functionality will be available on the slides. If a question arises, you can switch filters right on the slide or open another visual screen, and then quickly return to the next slide. Export presentations into PDF or Power Point.
Embedded Analytics
Use analytics from MPP BI as part of your digital platform. Embed dashboards into existing sections. Publish individual charts on your company’s website. We will keep all interactive features, provide automatic information updates and single authorization for users of your resources.
Data Export
Save charts as pictures, export tables into Excel or csv, download presentations as PDF or Power Point files, share links to analytical screens.